Kaivik.us: A Free Online Asset Market Cellphone Interface Experiment with Financial Bubbles
Paul Johnson
Https://Kaivik.us: A Free Online Asset Market Cellphone Interface Experiment with Financial Bubbles
Abstract
The author presents Kaivik, a free online asset auction classroom experiment platform that works with
cellphones. Students use cellphones to trade units of a financial asset (shares in a single company) by
submitting bid and ask prices plus the number of asset units they are offering to buy or sell per
transaction. In this “order book” system the liquidity of the asset market at any point in time is variable.
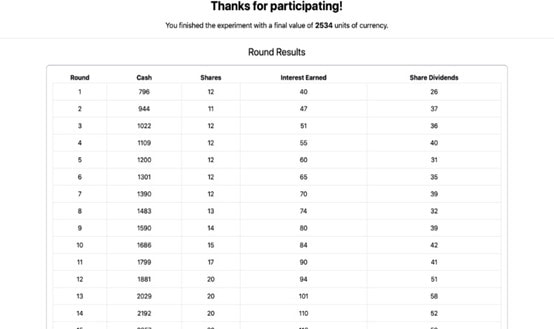
Trading can generate asset market bubbles. Instructors set key experiment parameters. Results are
recorded and can be presented on a screen for discussion. Students are given an experiment report
template to complete.
Kaivik is based on the 1988 research experiment by Smith et al. which demonstrated that
even under conditions of full knowledge of all relevant probabilities of future asset dividends there is
a replicable tendency for a financial asset market price to shoot above the fundamental value, then to
crash before the final expiration date.
A version of the experiment for classroom use was developed into a game hosted at Veconlab: Price_bubbles_with_discounting_a_web-based_classroom_experiment
Kaivik’s order book system (students enter bids and asks for multiple
units at a time instead of one unit per transaction) corresponds to real world market rules, in contrast to
other classroom finance market games which only permit trading one unit at a time.
Kaivik is the financial market counterpart to Kiviq, (https://www.kiviq.us/info) a real goods double
auction game based on the experiment by Smith (1962).
Kaivik is a more advanced and challenging classroom experiment for students than Kiviq because teams have to compete on two dimensions, not just price, but also quantity. It can be run with principals of economics students successfully but will work best for upper division students especially if they have done some finance courses.
These two classroom auction games generate strikingly opposite results. In the real goods markets (Kiviq)
price approaches predicted equilibrium: markets work well.
In financial asset markets (Kaivik) students typically generate a financial bubble with a collapse at the end: financial markets are volatile and can generate bubbles.
Acknowledgements
The author thanks Kyle Hampton for initiating the Kiviq/Kaivik project, Sarah Jacobsen for editing
suggestions, and Kyle Borash for programming. Financial support provided by the International
Foundation for Research in Experimental Economics and Conoco Phillips
Useful References
1. Smith, Vernon L. ;An Experimental Study of Competitive Market Behavior; Journal of Political
Economy 70, no. 2 (1962): 111-37. Accessed June 30, 2021. http://www.jstor.org/stable/1861810.
2. Smith (1962 )An Experimental Study of Competitive Market Behavior; Journal of Political
Economy, 70(3), 111-137
3. Bubbles, Crashes, and Endogenous Expectations in Experimental Spot Asset Markets
Vernon L. Smith, Gerry L. Suchanek and Arlington W. Williams
Econometrica
Vol. 56, No. 5 (Sep., 1988), pp. 1119-1151 (33 pages)
Published By: The Econometric Society
https://doi.org/10.2307/1911361
https://www.jstor.org/stable/1911361
4. https://www.researchgate.net/publication/247520807_Price_bubbles_with_discounting_a_web-based_classroom_experiment
5. Kiviq.us: “A free double auction Internet Classroom Experiment that Runs on any Student Device,”
The Journal of Economic Education. 51(2), p. 209